Initiatives Addressing Environmental Issues
Environmental Policy
In terms of environmental issues, we are contributing to the prevention of global warming by promoting the reduction of CO2 emissions through measures such as improving our operations to reduce energy consumption and introducing energy-saving equipment. Furthermore, with the objective of reducing our environmental load, we are aiming to support the realization of a resource circular society with a smaller environmental footprint by conserving water, implementing the 3Rs (reducing, reusing, and recycling resources), etc.
Environmental Targets
GHG Emissions in Scope 1 and Scope 2
(1) Long-term Target
Achieve net-zero emissions by 2050.
(2) Short-term Target
Reduce GHG emissions by 42% by 2030 compared with the 2021 level.
(3) Operational Targets
- ■For the areas over which MIRR has management authority, the medium- to long-term target is to reduce both energy consumption intensity (crude oil equivalent) and GHG emissions intensity by an annual average of at least 1.5% over a five-year period including the relevant fiscal year.
- ■As a short-term target, MIRR aims to reduce both energy consumption intensity (crude oil equivalent) and GHG emissions intensity by at least 1.5% year on year.
Water Consumption
The target is to reduce specific water consumption each year compared with the previous year across the entire portfolio and at individual properties.
Waste Disposal
The target is to improve the proportion of waste that is recycled each year compared with the previous year across the entire portfolio and at individual properties. For non-residential properties, we are currently striving to improve the measurement coverage rate and to promote the 3Rs and reduce waste quantities while asking tenants to support MIRR's approach as part of efforts to enhance tenant relations. At residential properties, since we cannot measure waste amounts, we will continue to conduct awareness activities aimed at tenants.
Environment-Related Data
Energy Consumption※1
This table can be scrolled sideways.
| Item | Unit | FY2020 | FY2021 | FY2022 | FY2023 | FY2024 |
|---|---|---|---|---|---|---|
| Total Energy Consumption※2 | MkWh | 13,162 | 14,103 | 10,842 | 9,852 | 10,331 |
| Fuel Consumption | MkWh | 2,024 | 3,288 | 1,493 | 987 | 957 |
| Electricity Consumption | MkWh | 11,138 | 10,815 | 9,350 | 8,865 | 9,374 |
| Energy Consumption Intensity | kWh/m2※3 | 123 | 146 | 132 | 120 | 114 |
| YoY Reduction Rate of Energy Consumption Intensity | % | 118.7% | 90.4% | 90.9% | 95.0% |
※1:Beginning with the FY2024 results, the calculation methodology has been revised. Energy consumption figures have been recalculated, including for prior years, to cover energy usage at assets over which the Investment Corporation has management authority.
※2:Due to rounding, totals may not equal the sum of individual figures.
※3:Energy consumption intensity figures are rounded to the nearest whole number.
Greenhouse Gas Emissions※1
This table can be scrolled sideways.
| Item | Unit | FY2020 | FY2021 | FY2022 | FY2023 | FY2024 |
|---|---|---|---|---|---|---|
| Scope 1 + 2 (Location-based) | t-CO2 | 5,319 | 5,281 | 4,335 | 4,060 | 4,142 |
| Scope 1 + 2 (Market-based) | t-CO2 | 5,827 | 6,269 | 5,108 | 4,080 | 5,168 |
| Scope 1 | t-CO2 | 363 | 598 | 268 | 177 | 177 |
| Scope 2 (Location-based) | t-CO2 | 4,956 | 4,683 | 4,067 | 3,883 | 3,965 |
| Scope 2 (Market-based) | t-CO2 | 5,464 | 5,671 | 4,840 | 3,903 | 4,991 |
| CO₂ Emissions Intensity | kg-CO2/m2※2 | 55 | 65 | 62 | 50 | 57 |
| YoY Reduction Rate of CO₂ Emissions Intensity | % | 118.2% | 95.4% | 80.6% | 114.0% | |
| Scope 3 (Category 13)※3 | t-CO2 | 1,960 | 4,629 | 4,997 | 4,396 | 5,214 |
※1:Beginning with the FY2024 results, the calculation methodology has been revised. Scope 1 and Scope 2 emissions have been recalculated, including prior years, based on energy-related greenhouse gas emissions from assets over which the Investment Corporation has management authority.
※2:CO₂ emissions intensity is calculated based on Scope 1 and 2 emissions (market-based), and figures are rounded to the nearest whole number
※3:Scope 3 emissions (Category 13) represent emissions attributable to tenant-leased properties (downstream) for which the Investment Corporation does not have management authority, such as single-tenant leased assets.
Water Consumption
This table can be scrolled sideways.
| Item | Overall | |||||
|---|---|---|---|---|---|---|
| FY2019 | FY2020 | FY2021 | FY2022 | FY2023 | FY2024 | |
| Total water consumption (thousands of m3): A+B | 134.8 | 110.7 | 180.3 | 186.8 | 179.2 | 202.8 |
| Externally purchased water consumption (thousands of m3): A | 132.4 | 108.6 | 177.6 | 183.6 | 175.8 | 198.8 |
| Other water consumption (thousands of m3): B | 2.4 | 2.1 | 2.7 | 3.2 | 3.4 | 4.1 |
| Specific water consumption (m3/m2): for A* | 0.83 | 0.69 | 0.84 | 0.84 | 0.69 | 0.70 |
| Year-on-year specific water consumption reduction rate (%) | - | 82.9% | 122.5% | 99.7% | 82.2% | 101.4% |
N.B.:The intensity for * is rounded off after the second decimal point.
Waste Generation
This table can be scrolled sideways.
| Item | Overall | |||||
|---|---|---|---|---|---|---|
| FY2019 | FY2020 | FY2021 | FY2022 | FY2023 | FY2024 | |
| Total waste generation (t) | 936.10 | 1,108.90 | 1,358.09 | 948.89 | 607.58 | 854.63 |
| Total general waste generation (t) | 936.10 | 1,108.90 | 1,358.09 | 948.89 | 607.58 | 854.63 |
| Total industrial waste generation (t) | 0.00 | 0.00 | 0.00 | 0.00 | 0.00 | 0.00 |
| Ratio by waste disposal method | ||||||
| Recycling (%) | 41.4 | 39.5 | 33.6 | 27.3 | 20.3 | 31.1 |
| Reused (%) | 0.7 | 0.5 | 0.4 | 0.4 | 0.7 | 0.0 |
| Thermal recycling (%) | 11.9 | 17.3 | 0.1 | 0.1 | 0.0 | 0.0 |
| Incinerated (%) | 26.2 | 24.6 | 33.0 | 39.3 | 27.2 | 61.9 |
| Landfill (%) | 5.8 | 8.6 | 7.9 | 0.6 | 0.9 | 1.4 |
| Unknown (%) | 14.0 | 9.5 | 25.1 | 32.4 | 50.9 | 5.7 |
N.B.:The intensity for * is rounded off after the decimal point.
Basis for Calculating Environmental Performance
This table can be scrolled sideways.
| Item | Energy Consumption | Greenhouse Gas Emissions | Water Consumption | Waste Generation |
|---|---|---|---|---|
| Assumptions for Calculation Methodology |
|
|
|
- |
| Intensity calculation method |
\[ \sf Intensity = \frac{Energy\ consumption\ amount\ or\ greenhouse\ gas\ emission\ amount\ or\ water\ consumption\ amount}{Total\ floor\ area*} \] *The total floor area here is the sum of the total floor areas based on the calculation method indicated in “Intensity denominator”. |
- | ||
| Definition of the Intensity Denominator |
|
|||
| Reporting Boundary |
|
|||
| Reporting Period |
|
|||
Initiatives Addressing Environmental Issues at Assets under Management
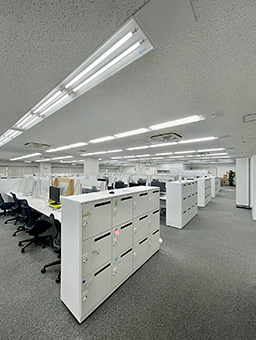
The Asset Manager is engaged in energy-saving upgrades and improvements to building operations for the purpose of reducing the portfolio's environmental footprint and improving the interior environment.
Energy-Saving and LED Conversion Work
Conversion to LED lighting is progressing at 60 properties (including partial conversion) in the portfolio. The LED conversion rate for the portfolio is as shown below (based on floor area; as of the end of Auguest 2025).
This table can be scrolled sideways.
| No. of Properties (including partial implementation) |
LED Conversion Rate across Portfolio | ||
|---|---|---|---|
| LED conversion work | 62 | Total: 74.7% | In common areas: 91.4% |
| In private areas: 65.6% | |||
Higashi-Ikebukuro Central Place (private areas)
Renewable energy
Renewable energy generation
The amount of renewable energy generation at MIRR’s portfolio properties is as follows
This table can be scrolled sideways.
| FY2019 | FY2020 | FY2021 | FY2022 | FY2023 | FY2024 | |
|---|---|---|---|---|---|---|
| Solar power generation (kWh) | 312,713 | 371,566 | 350,752 | 367,121 | 348,327 | 335,114 |
*All electricity generated is sold to Shikoku Electric Power Company, Incorporated

C-05 YAMADA web.com Matsuyama Toiyacho (Rooftop Solar Panel)
Status of initiatives to introduce renewable energy
The MIRARTH HOLDINGS Group, MIRR’s main sponsor, engages in energy business utilizing renewable energy that contributes to reductions in the emissions of CO₂, a greenhouse gas, and is involved in the development and operation of biomass and wind power as well as solar power facilities.
At the time of publication of this report, the status of renewable energy introduction at the properties owned by the Investment Corporation is as follows.
| Asset | Property name | Implementation Period |
|---|---|---|
| Office | Hakata Gion Building | October 2025 |
| HAKATA REISENMACHI Building | ||
| Residential (Common Areas) |
LUXENA HEIWADAI | June–July 2025 |
| LUXENA KACHIDOKI | ||
| LUXENA KADOMA | ||
| LUXENA TODAKOEN | ||
| LUXENA TODAKOENⅡ | ||
| LUXENA AKIHABARA | ||
| LUXENA MUSASHI-SHINJO | ||
| LUXENA NAGAREYAMA OOTAKANOMORI | ||
| LUXENA KITASENJU | ||
| LUXENA JOSHIN | ||
| LUXENA TOYOCHO | ||
| LUXENA HACHIOJI MINAMICHO | ||
| LUXENA KINSHICHO | ||
| LUXENA HEIWAJIMA | ||
| LUXENA HACHIOJI SHINCHO | ||
| LUXENA TABATA-KITA | ||
| LUXENA WAKO |
*Renewable energy-based electricity supply is scheduled to commence at L.Biz Sendai and Jozenji-dori Square Building in April 2026.
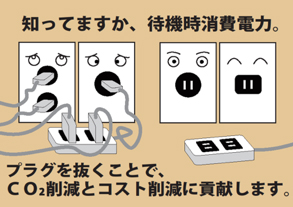
Reduction of Greenhouse Gas Emissions
We are striving to create a shared power-saving culture through measures such as putting up awareness posters in common areas and tenants' private areas.
(Putting up power-saving awareness posters)

Reducing Water Consumption
At one of the properties in the portfolio, NT Building, rainwater is reused as flushing water in the bathrooms. Furthermore, we are striving to promote the conservation of water resources on an ongoing basis, such as completing work to install water-saving packing at 7 of the portfolio properties and pursuing awareness activities aimed at tenants.
(Displaying water-conservation posters)

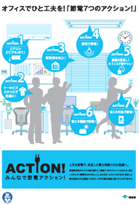
Waste Reduction
As an initiative to reduce waste in office buildings, we are pursuing awareness activities aimed at tenants in collaboration with property and building managers.
(Displaying awareness posters)